Create your first map
From an empty map to a styled, saved web map: add a layer, pick a basemap and a coordinate system, style it, and save. Takes about ten minutes with your own data.
Creating maps requires the Editor role or higher. If you haven’t uploaded any data yet, that’s fine — you can upload straight from inside the map.
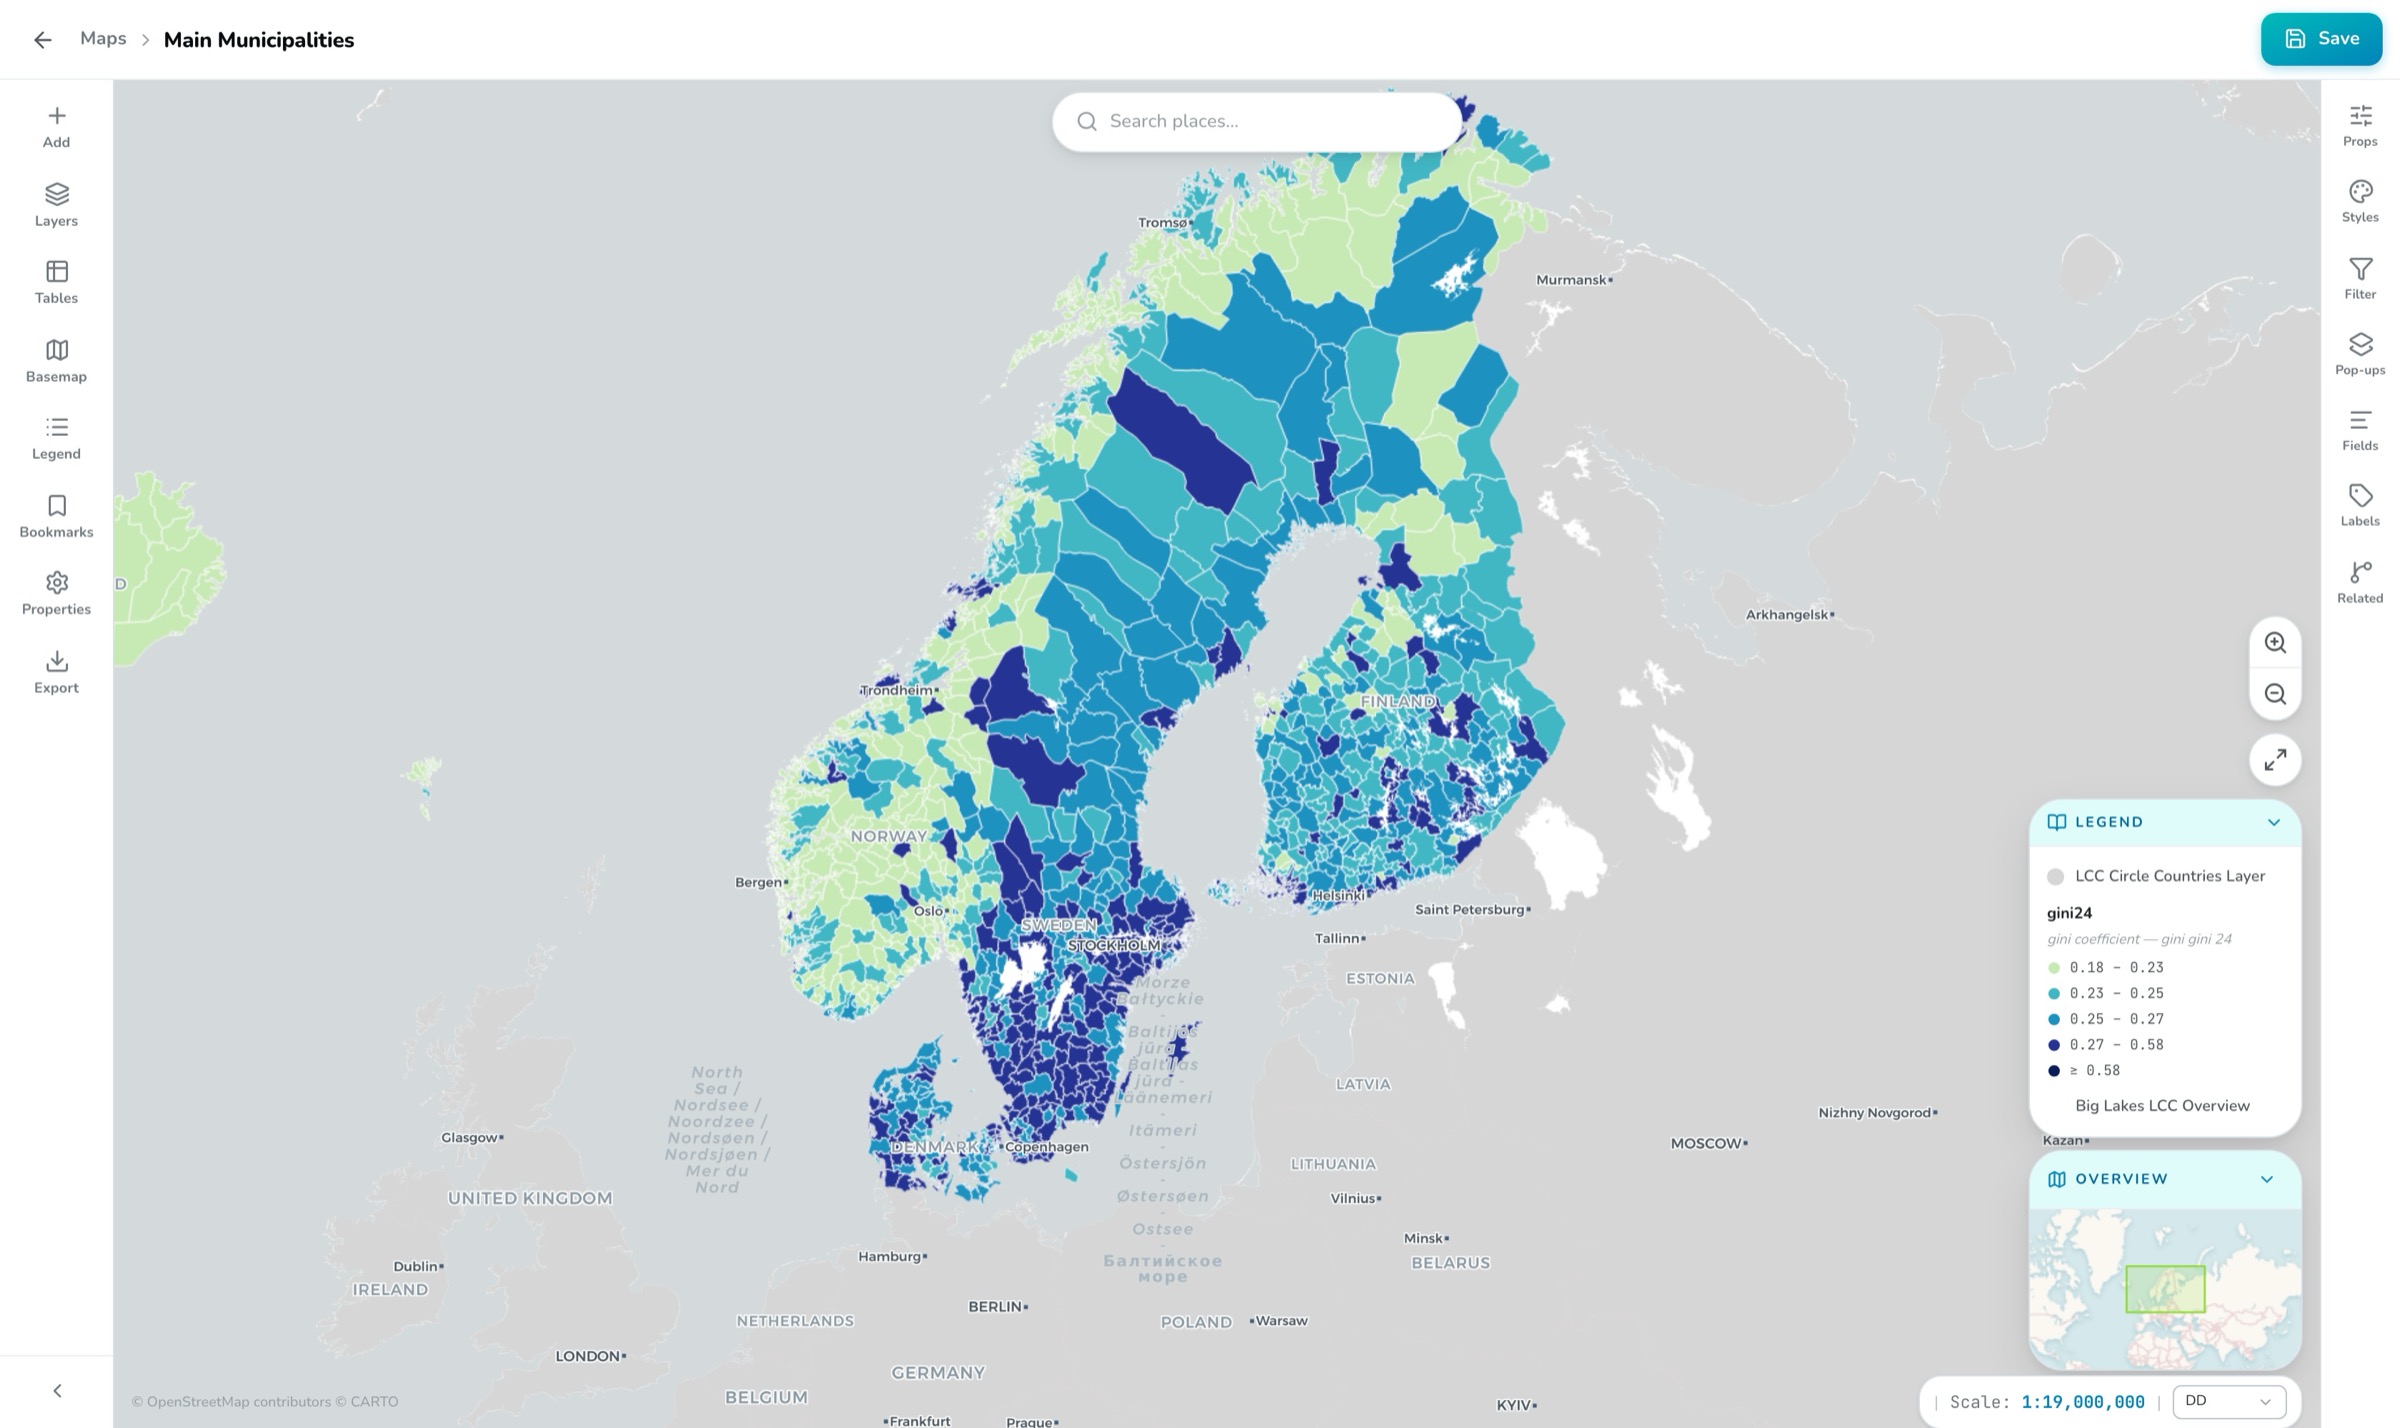
Create the map
Open Maps in the portal header and press Create map. A new untitled map opens in the map viewer.
Add a layer
Open the Add panel in the left rail. Browse My Content for datasets already in your organization, add a tile service by URL under Tile Layers, or use the Upload tab to drop a file (GeoJSON, Shapefile, GeoPackage, KML, GeoParquet or CSV) — the layer appears on the map as soon as processing finishes.
Pick a basemap
Open the Basemap panel. The gallery is grouped into General, Imagery and Topographic, and only shows basemaps compatible with your map’s coordinate system — Lantmäteriet for Sweden, GISCO for Europe, Kartverket for Norway, plus worldwide options from CARTO and Esri.
Choose the coordinate system
In Properties → Map Projection, pick the CRS your organization works in — for example SWEREF99 TM (EPSG:3006). Featured entries have native basemaps. See Coordinate reference systems for the full catalog.
Style the layer
Click the layer in the Layers panel — the right-hand toolbar appears. Under Styles, choose a symbology mode: Single color, Graduated (a numeric field over a color ramp) or Categorical (one color per value). Adjust fill and border, pick a point icon, or turn on clustering under the layer’s Props.
Configure pop-ups
With the layer still selected, open Pop-ups. Enable them, set a title template using
{field}variables, and compose the content from blocks: a fields table, rich text, or related records.Save
Press Save (or
Ctrl+S). The first save opens the Save Map dialog — give the map a title, an optional description and a folder. After that, Save persists directly; the header shows an Unsaved pill whenever there are pending changes.
Where your map can go next#
- Use Share in the map header for a link to the map for people in your organization (with a QR code).
- Drop the map into a dashboard — every chart and indicator binds to its layers.
- Tell a story around it in a Journey, or lay it out for print in a Print Layout.
- Maps don’t get standalone public URLs — they become publicly visible when a published dashboard, journey or survey embeds them. See Sharing & publishing.
The map viewer has much more than this tutorial touches — filters with AI assistance, labels, bookmarks, a feature table, image export. The full tour is in Web Maps.