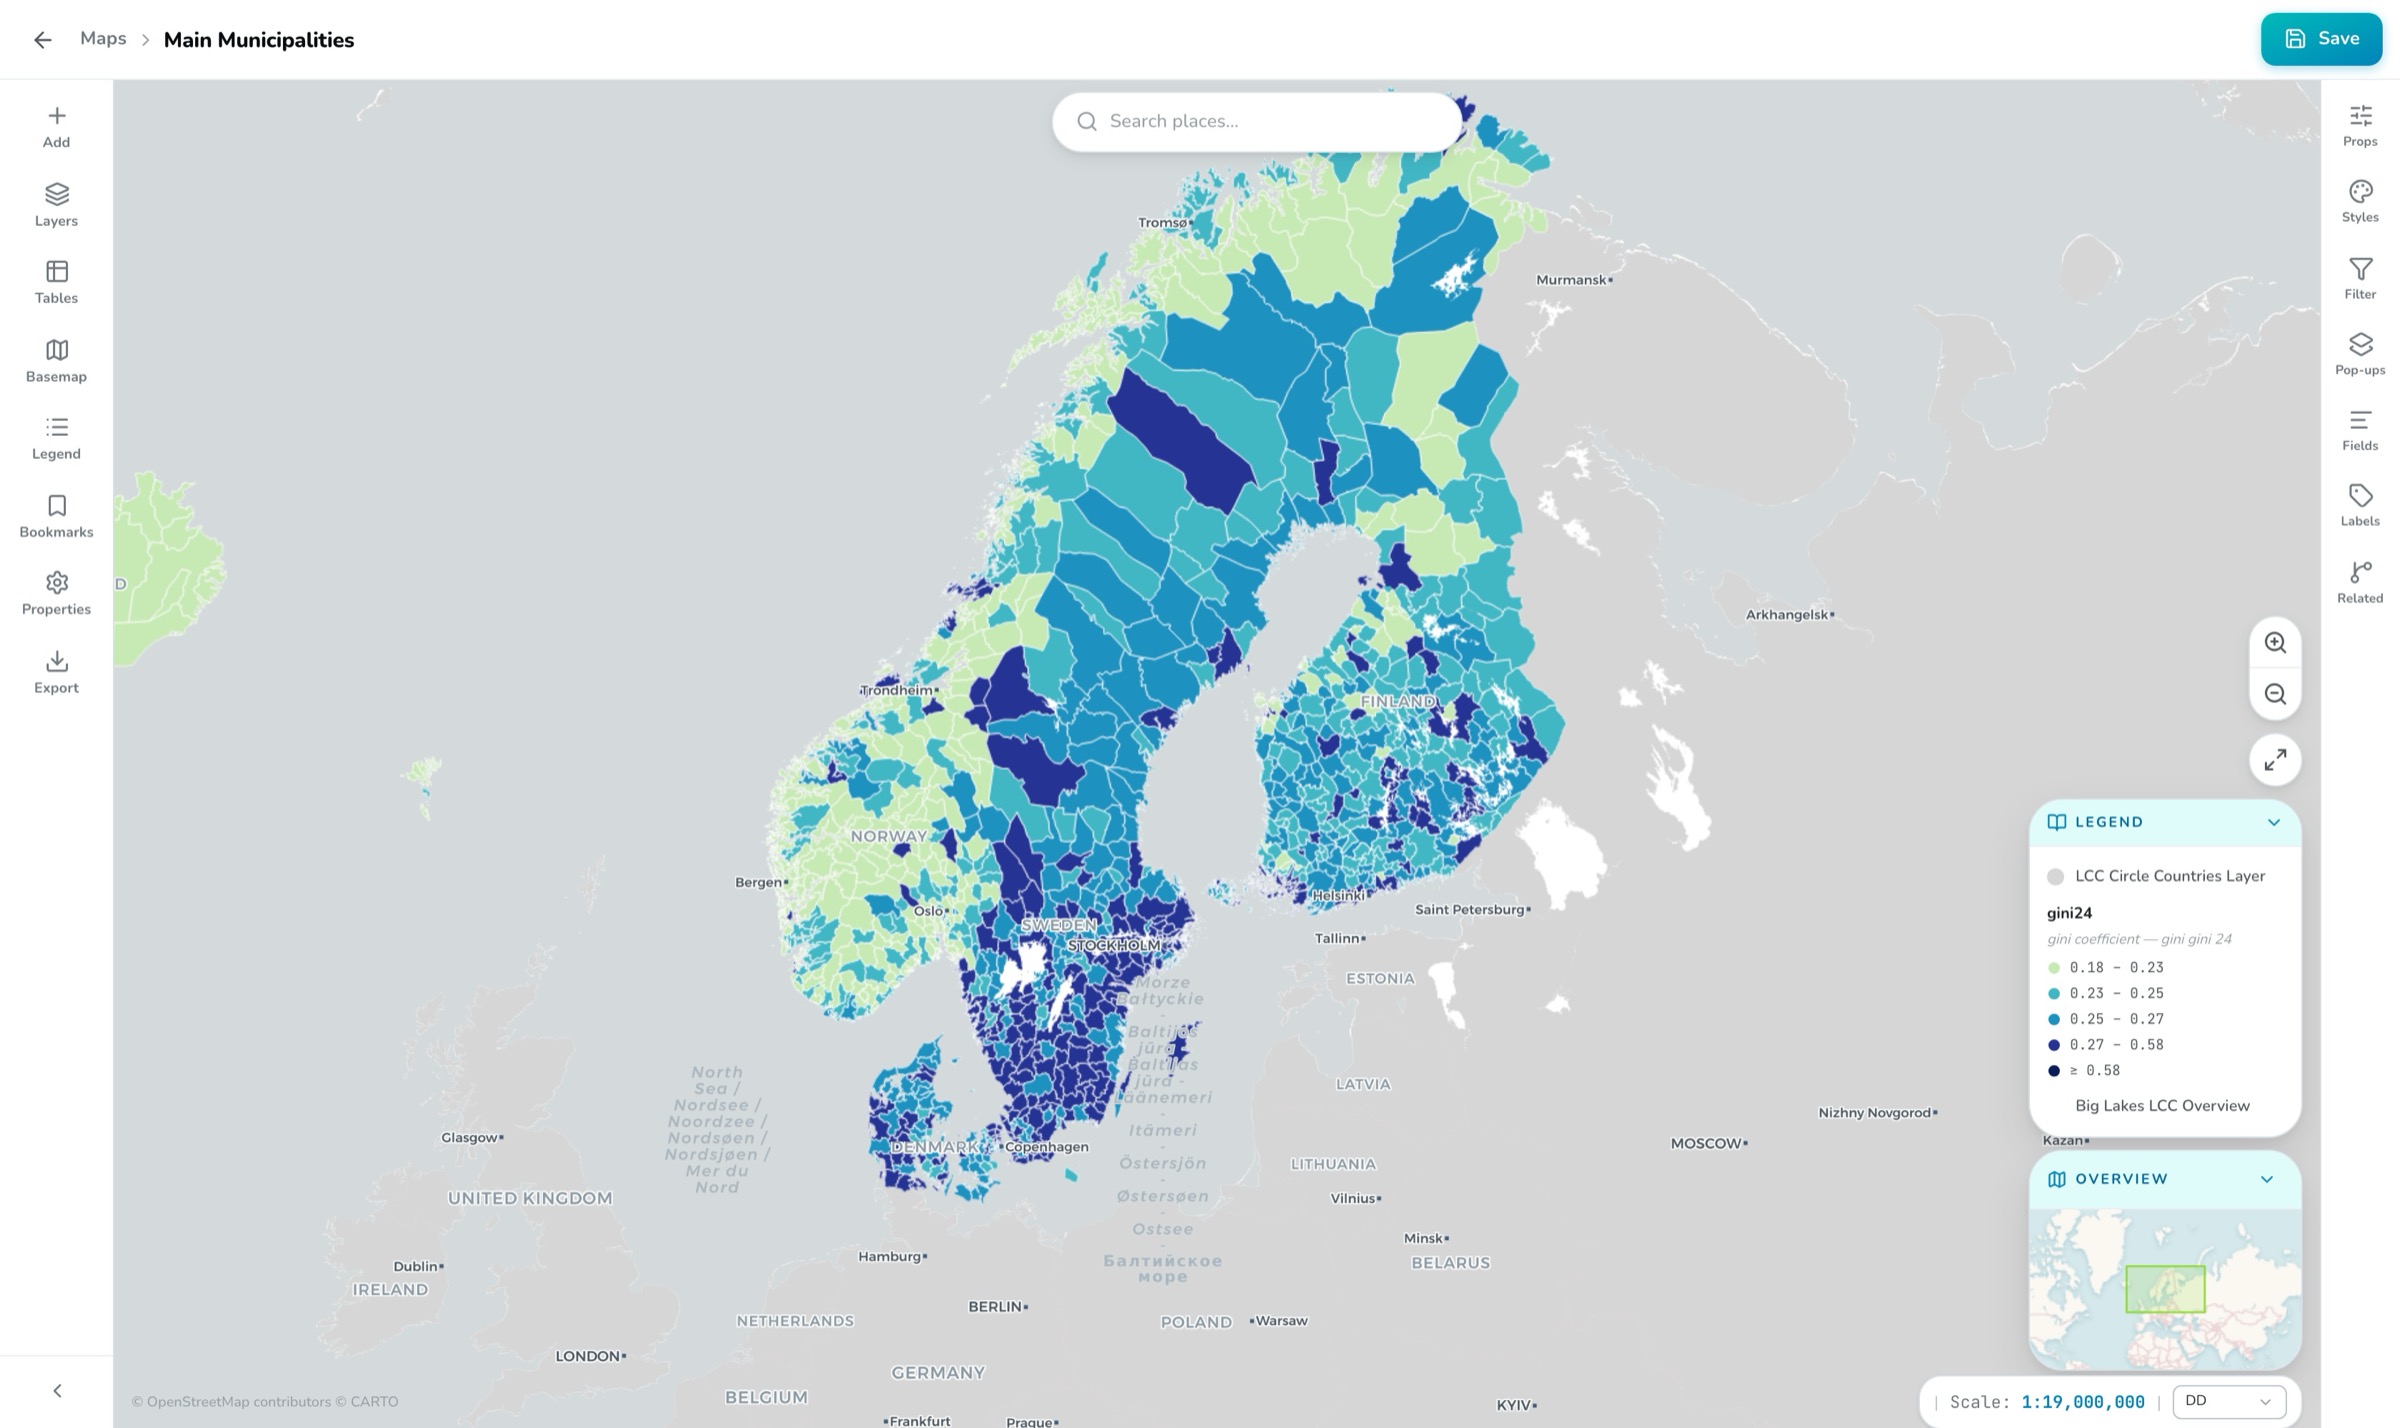
The web map — graduated symbology for Nordic municipalities, right in the browser
The heart of OrbGIS is our tool for building web maps. Symbolize, filter, label and manage your fields and related records directly in the browser.
The web map — graduated symbology for Nordic municipalities, right in the browser
When you open a new web map, you'll easily find every tool you need in the panels to the left and right of the map view. These panels let you control both the map's own properties — like its name and chosen coordinate system — and the properties of each layer you add. Adjust symbology to highlight the patterns you've found in your data, and use filtering when only part of the dataset should show on this particular map. Enable access to a layer's related records to use them as the basis for both visualization and, for example, pop-ups.
Thanks to server-side functionality, our web maps deliver world-class performance. That means you can expect even visually heavy datasets with millions of features to render completely smoothly — no slow buffering.
Something that especially sets OrbGIS apart is that you choose which coordinate system to work in yourself — you're never locked to whatever the web happens to default to. Over 20 coordinate systems ship built in, SWEREF 99 TM with all twelve local zones among them, naturally. Want to see the full list? Read more here.
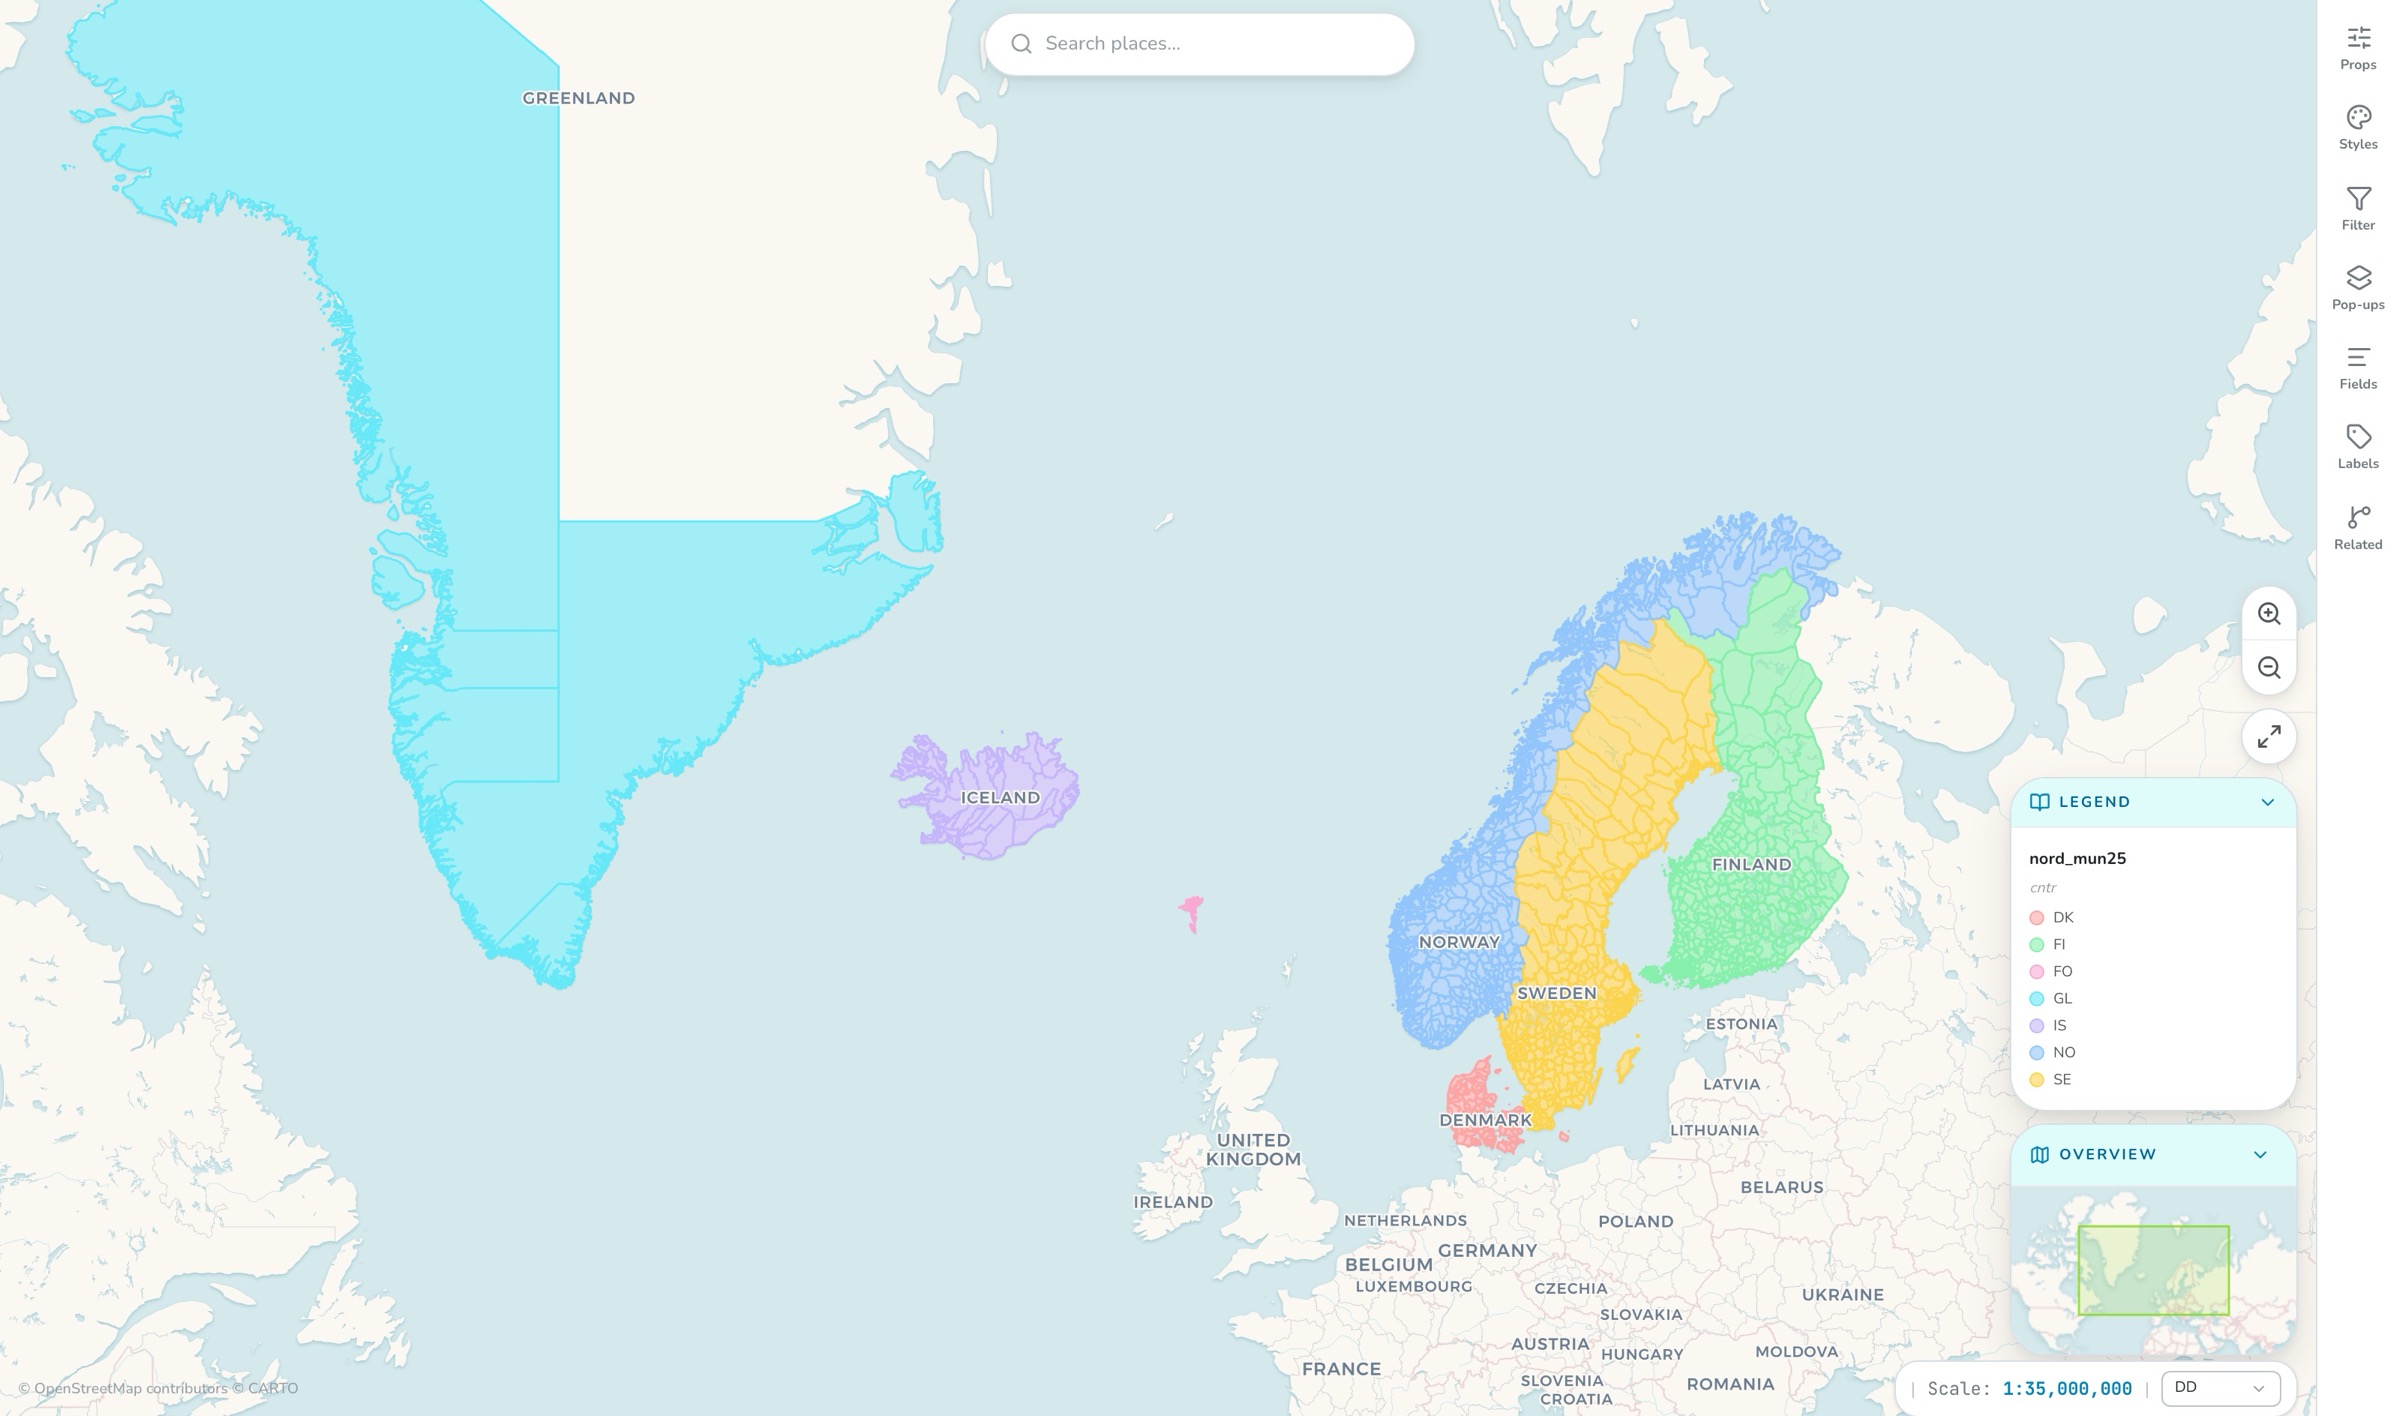
Choose to symbolize your layers as single color, graduated or categorical. Large point layers get support for heatmaps and aggregation. Want to visualize only part of your layer? Apply a filter — and for anything really complicated, just have our AI write the filter for you.
If your layer has one or more related tables, you can use that data for things like symbology. Just enable the table you want for this map, and its fields are available right alongside your own.
Build popup bodies from ordered blocks: field tables, rich text with {field} variables and related-records sections. Drag to reorder. Field aliases and formats come along from the Fields panel. Need advanced formatting? Full HTML support is built in.
With over 20 coordinate systems behind it, you choose which one to work in — never stuck again with a preset coordinate system that distorts your data.
Choose from the whole OrbGIS basemap gallery. Every one is tuned to work well in your chosen coordinate system, so if you don't see all 22 at once, some are simply hidden because they're not compatible with your data. Built your own basemap? Of course you should use it — just add it in.
Thanks to server-side functionality, every large layer renders extra efficiently through pre-aggregation. It's nothing you need to think about, or even notice — except that you'll never again wait for a layer to draw.
From an empty map to a styled, saved web map: add a layer, pick a basemap and a coordinate system, style it, and save. Takes about ten minutes with your own data.
→The map viewer is the heart of OrbGIS: style, filter, label and share vector layers in the browser, in the coordinate system you actually work in.
→Work in the CRS your organization actually uses. SWEREF 99, ETRS89 grids and more are first-class citizens — not everything is forced through Web Mercator.
→Datasets are OrbGIS’s working unit: hosted feature layers and attribute tables with typed fields, relationships, statistics — and vector tiles behind every map.
→Get finished output out of OrbGIS: map images up to print resolution, layout PDFs, and CSV extracts of your data.
→
No demo call. No sales funnel. Sign up to make your first map.